information overload
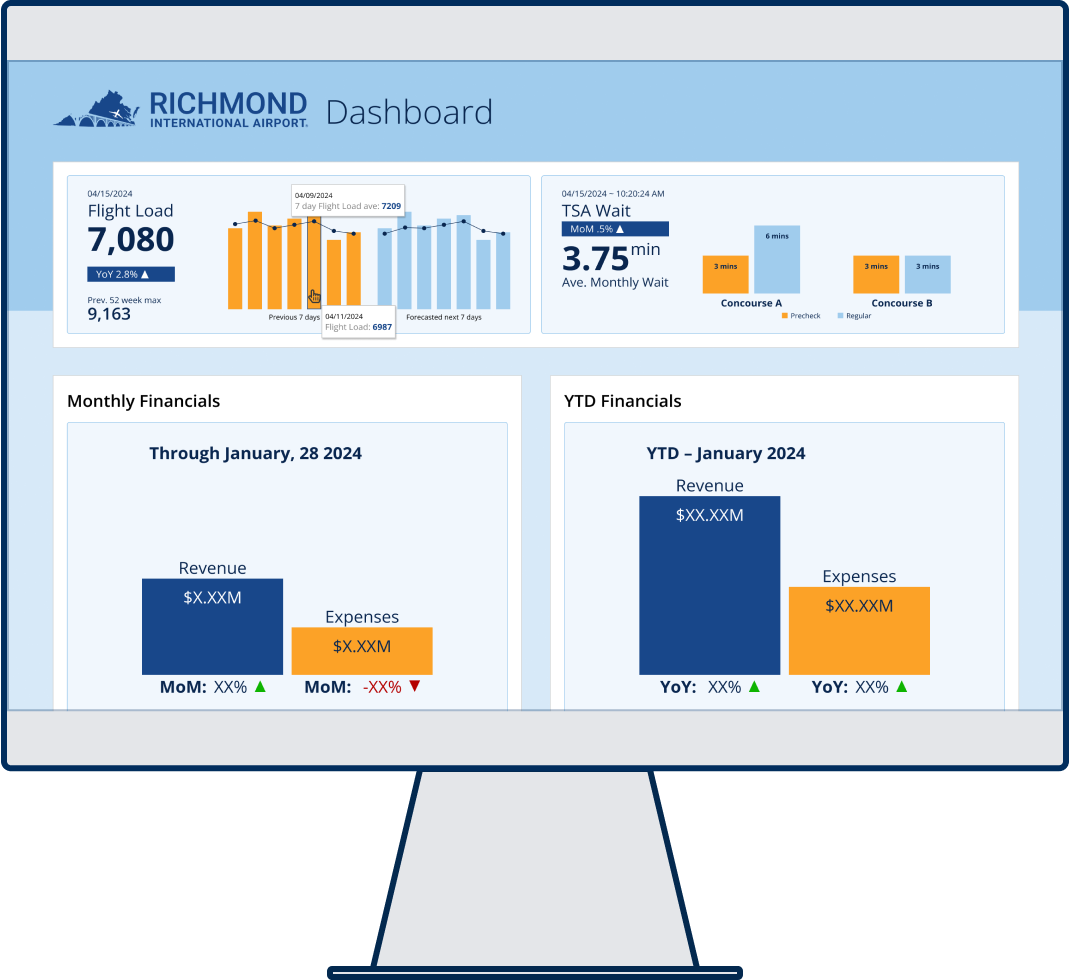
Can you pack all the real-time operations data from Richmond International Airport (RIC) into a quick glance on a mobile screen? When Perry J. Miller, the 2023-2024 chair of the American Association of Airport Executives and president and CEO of central Virginia’s largest airport, asked West Cary Group, our answer was “Yes,” adding, “Let’s include parking data, too.”
aerial analytics
As RIC’s agency of record since 2012, WCG is no stranger to their organization. However, we didn’t want to rely on assumptions to drive the greatest impact. Requirement meetings were held to ensure everyone was on the same page. We needed to understand the insights RIC wanted their reporting to provide – from the airport’s financial health today to opportunities for tomorrow. Leaving no blind spots, we carefully scrutinizing financial, security, customer service, and fire rescue data.
a soaring success
Since the dashboard’s launch, it has become a key strategy tool at all levels of RIC, and their leadership has now requested three possible subsequent phases targeting visitor parking reporting and more.
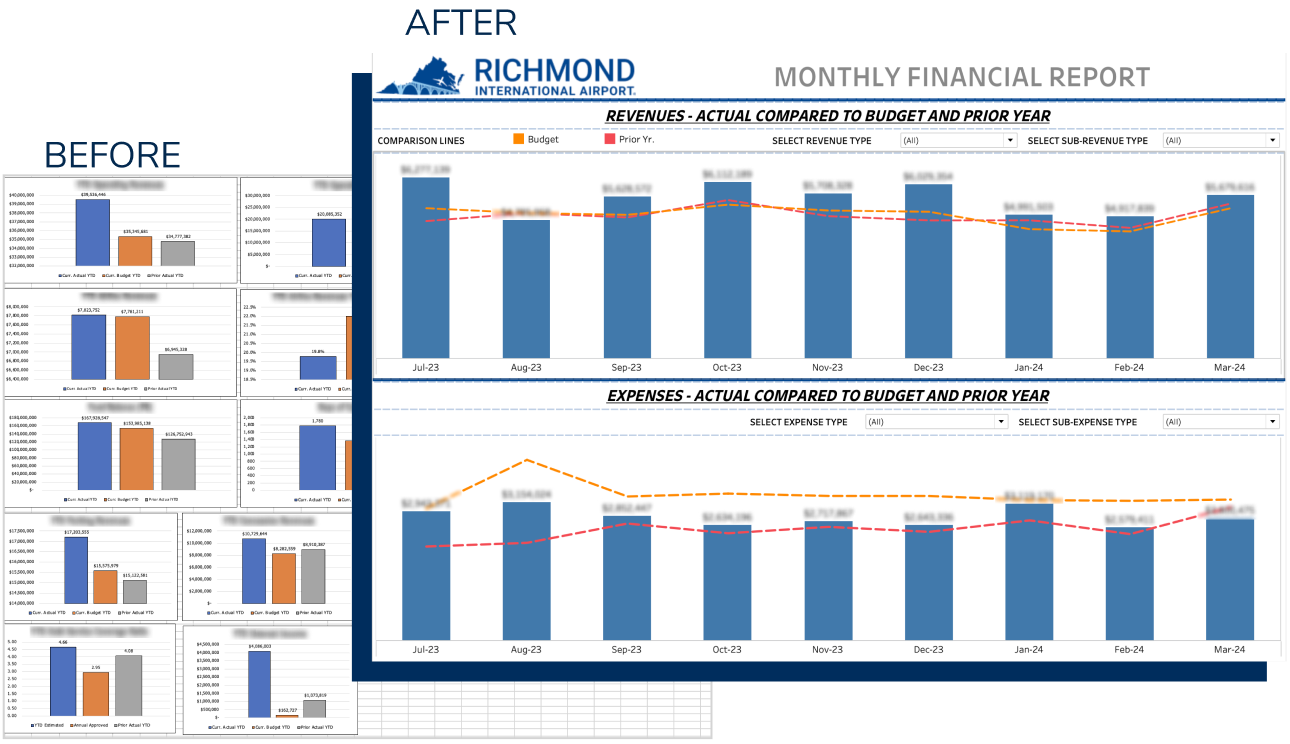
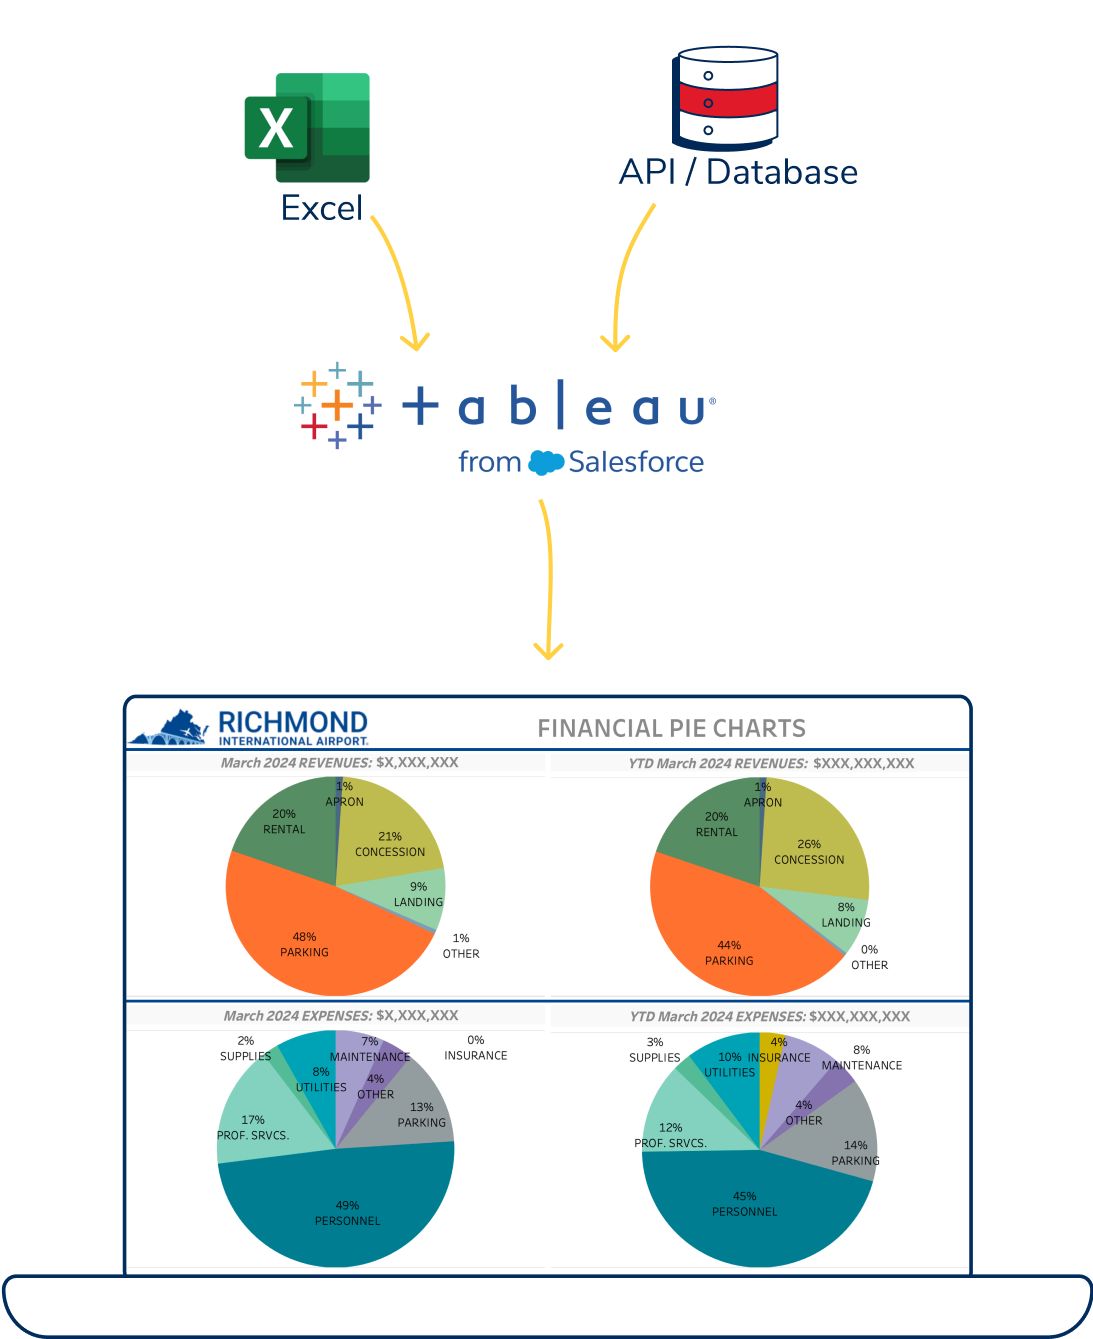
While WCG did indeed deliver a sleek operations dashboard for RIC executives, the bigger picture was behind this fresh coat of paint. We saved them time and money by overhauling the airport’s reporting process with automation and putting it into one central digital location. Further, WCG helped eliminate the hours and dollars RIC had been burning on trying to make sense of operations data using manual spreadsheets throughout their business.
Outcome:
As a result, the efficiency gains for the leadership team allowed for better operations planning and secured longterm financial security